
Here’s a question I ask every business owner I work with: Do you measure your success? And the answer is almost always yes. Then I ask the follow-up: How?
- In an illustrative model using 30 people, 15 minutes each per week, 4.2 weeks per month and 12 months, updates total 378 hours; at an assumed $100 an hour, that is $37,800 in opportunity cost, not measured savings.
- Ai1 agents use small API connectors to pull numbers from tools such as QuickBooks, HubSpot, Xero, Salesforce and Google Sheets automatically.
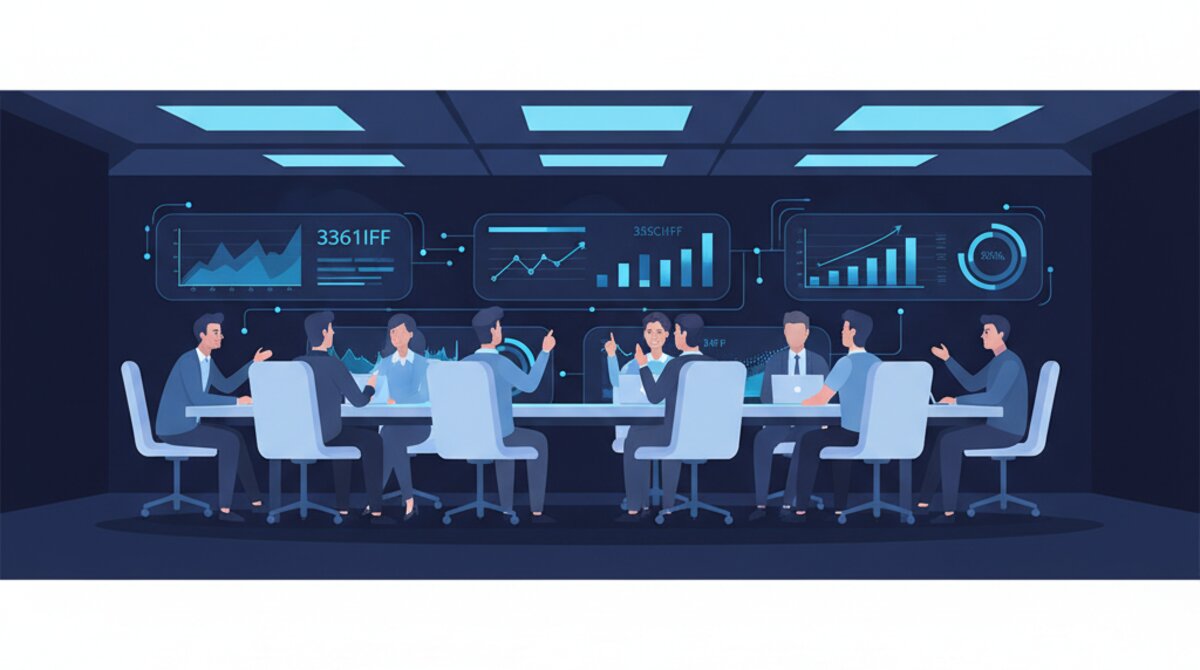
- The finished scorecard arrives in Slack or your inbox on the cadence your L10 meetings need.
- Automated numbers remove the excuses, so the meeting shifts from 'do we have the numbers?' to 'what do we do about them?'
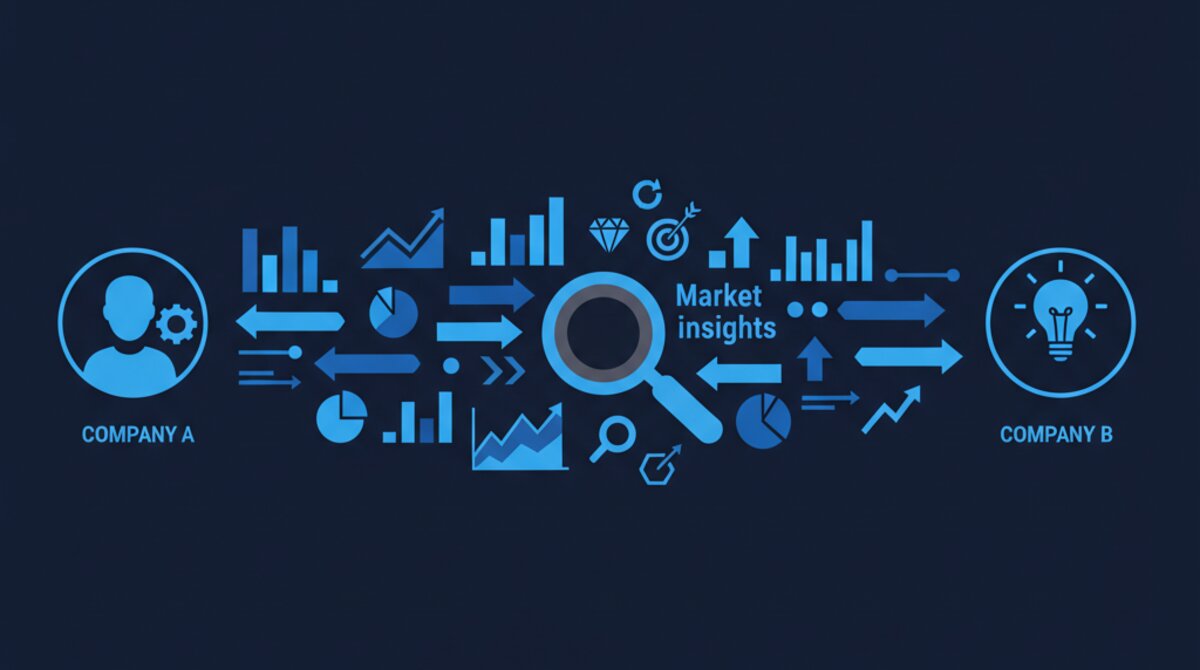
- Once the data plumbing is in place, the same agents can add competitive, industry and pricing analysis.
That’s where it gets interesting. Because what most people describe isn’t really measurement — it’s a vague sense of how things are going based on whatever numbers they happened to glance at last week. The revenue looks okay. The team seems busy. The pipeline feels full. We’re probably on track.
Probably.
If you run your company on EOS — the Entrepreneurial Operating System — you know what a weekly scorecard is supposed to look like. Every manager, every week, has a weekly L10 meeting where they present their scorecards and review their rocks. It’s one of the most powerful frameworks in business. And it’s also one of the most painful to maintain.
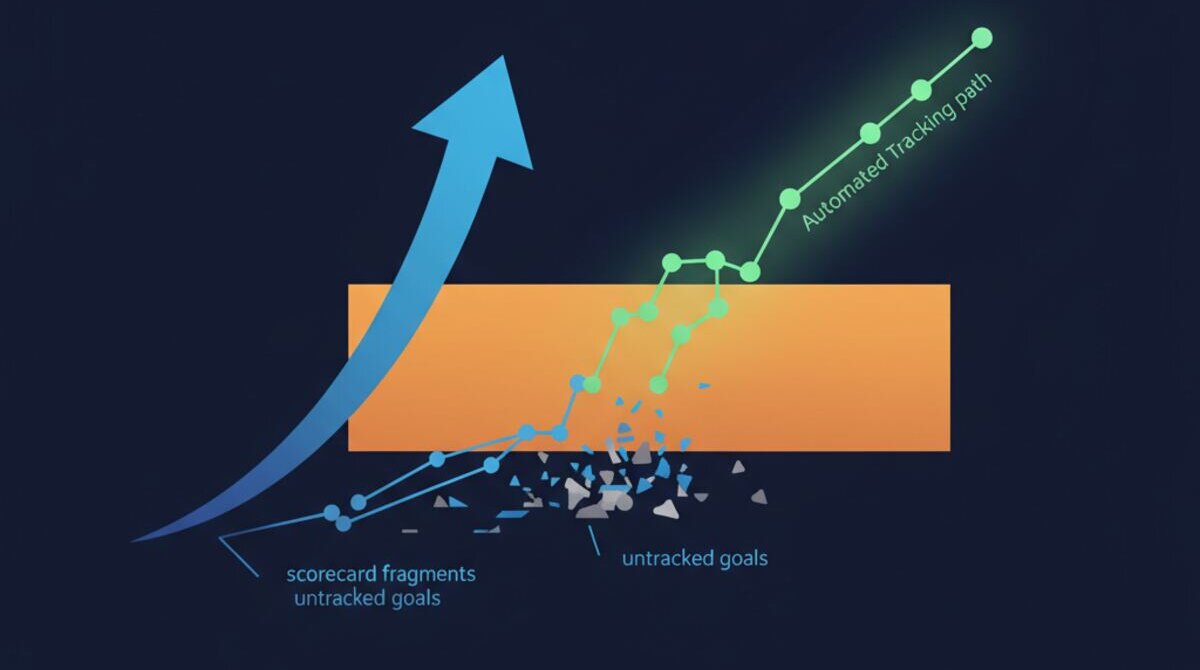
Because here’s the thing about human beings: we are inherently biased against tracking things, especially when tracking reveals that we’re not performing well. Nobody wants to be the person who shows up to the L10 with red numbers. So what happens? People avoid it. They procrastinate on pulling the data. They round up. They present last week’s numbers because this week’s aren’t ready yet. The scorecard becomes a performative exercise rather than a strategic tool.
That’s the problem AI was born to solve.
An Illustrative $37,800 Calculation

Let me walk you through some maths that will make you uncomfortable.
For an illustrative calculation, take a company with 30 employees. Assume each person spends 15 minutes a week updating scorecard metrics — logging into systems, pulling numbers, updating spreadsheets and preparing for the weekly meeting. That is an assumption, not a measured average. Use your own time records to test whether it fits your team.
15 minutes times 30 employees means you’re spending 450 minutes a week on scorecard maintenance across the organisation. Using the stated approximation of 4.2 weeks per month gives 1,890 minutes a month. Multiplying by 12 months gives 22,680 minutes for the modeled year; this uses 50.4 weeks, not a full calendar year.
Divide by 60. That is 378 hours of scorecard maintenance in this illustrative model, not a measured industry average.
Now here’s where it hits: what’s the opportunity cost of those hours? At an assumed opportunity cost of $100 an hour, that is $37,800 per modeled year, not necessarily cash savings. That is time that could be spent on other work. The amount that can be automated depends on the workflow.
And that’s a 30-person company. At 90 employees, the same assumptions give an illustrative $113,400 a year in opportunity cost. For a 200-person company? You can do the maths yourself, but I promise the number will make you wince.
MyZone reports this unnamed team’s estimate, not an industry benchmark: “We calculated that our team was spending over 400 hours a year on scorecard preparation. That’s ten full working weeks. When you put it that way, automating it wasn’t a nice-to-have — it was negligent not to.”
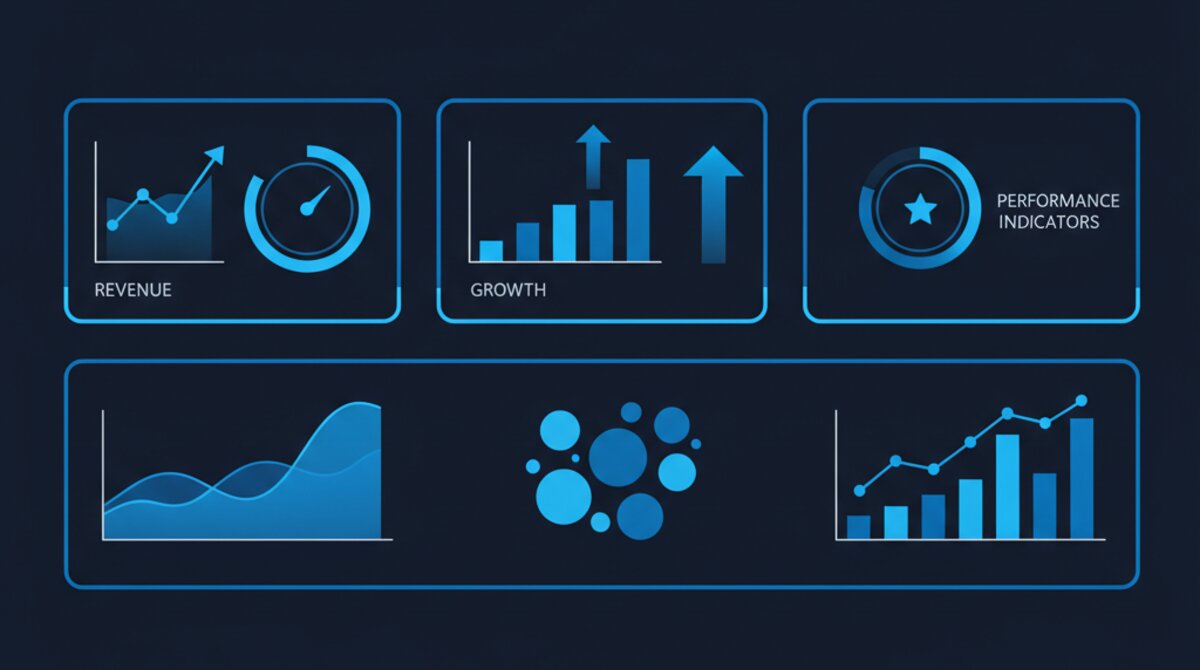
In Ai1, the Reporting agent does this work for your team.
What It Actually Costs to Automate This
Pricing follows the standard Ai1 plans.
The setup work depends on your tools and reporting needs. We build small AI agents on top of the Ai1 platform, each one designed to connect to your existing tools, pull the relevant data, and generate scorecard reports automatically.
Compare that to the annual cost of doing it manually. Break-even depends on actual labor saved and the full cost of implementation and operation. The illustrative labor-cost model is not measured ROI; include setup, recurring platform and provider costs, maintenance and human review before estimating a return. And unlike a human analyst, the AI agent doesn’t take holidays, doesn’t round up, and doesn’t get nervous about presenting bad numbers.
How the Plumbing Actually Works
I want to demystify this because I think a lot of business owners hear “AI automation” and imagine something enormously complex. It’s not. The technology has become remarkably simple. Intuit's developer reference lists profit-and-loss reports among the data available to integrations.
Connectors can pull data from tools such as:
- QuickBooks
- HubSpot
- Google Analytics
- Asana
- Xero
- Salesforce
- Google Sheets
Each connector is like a little pulse. It reaches into the application, grabs the relevant numbers, and brings them back to the AI agent. The agent then stores everything in a simple Google Sheets document — not because we need fancy infrastructure, but because Google Sheets is accessible, transparent, and something your team already knows how to read. Google's Sheets API can read and write spreadsheet cell values.
Once the data is collected, the AI agent runs the analysis. It doesn’t just compile numbers into a table. It reads them like a senior strategist would: cross-referencing financial performance with customer metrics, looking for correlations between process efficiency and growth, spotting early warning signs that would take a human analyst days to uncover.
Then it delivers the finished scorecard on a schedule. Every week, every fortnight, every month — whatever cadence works for your L10 meetings. It shows up in your Slack channel or your inbox on Monday morning, ready for the team to review. No manual effort. No login marathons. No broken spreadsheet formulas.

The Accountability Revolution
Here’s something that caught me off guard when we first deployed this: the accountability shift.
When scorecards are manual, there’s always plausible deniability. “I didn’t have time to pull the numbers this week.” “The system was down.” “I’m waiting on finance to send me the data.” These are all reasonable-sounding excuses, and managers hear them every week.
When the AI agent generates the scorecard automatically, those excuses disappear. The numbers are there. They’re current. They’re accurate. Nobody can hide behind process friction anymore. And the conversation in the L10 meeting shifts fundamentally — from “do we have the numbers?” to “what do the numbers tell us, and what are we going to do about it?”
That’s the conversation you actually want to be having. That’s where strategic value lives. Every minute your team spends gathering data is a minute they’re not spending acting on it.
The Layered Intelligence Opportunity
Once you have automated scorecard tracking in place, something interesting happens: you start seeing opportunities for deeper analysis that you never had the bandwidth to pursue before.
With the basic plumbing in place, the same AI agents can layer on competitive analysis — pulling publicly available data about your competitors and benchmarking your performance against the market. Industry analysis that tracks sector trends and positions your metrics in context. Pricing analysis that correlates your pricing changes with customer acquisition and churn patterns. NPS deep-dives that go beyond the top-line score to segment-level insights. Employee satisfaction tracking that connects culture metrics with operational performance.
None of this was practical before because the foundational data collection was eating all your bandwidth. Automating scorecard collection can free capacity for analysis, but specialist time, data quality and review still limit what you can do.
Where This Goes Next: The Strategy Automation Stack
Scorecard tracking is just the first layer of what we’re building at MyZone AI. Once you have automated KPI collection and analysis, the natural next steps open up:
Natural next steps once KPI collection is automated:
- Rock accountability tracking
- Rock alignment analysis
- Roadblock analysis
Quarterly meeting prep — instead of spending two days assembling board decks, the AI generates a comprehensive quarterly review with trend analysis, forecasts, and recommended focus areas. Annual planning support — historical trend analysis, scenario modelling, and strategic recommendation engines that draw from your actual performance data rather than gut feel.
AI readiness assessment — a continuous evaluation of where your organisation is in its AI maturity, what the next highest-value automation opportunity is, and what capabilities you need to build. Deep research automation — AI agents that conduct market research, competitive intelligence, and trend analysis on demand.
Each of these builds on the same foundation: AI agents connected to your business tools via secure API connectors, running scheduled analyses, and delivering insights where your team actually works. The scorecard is the starting point because it’s the most universal need, but the stack grows from there.
Giving Small Businesses More Analytical Support
Here’s what excites me about this: a small company can use automated reporting and analysis to support decisions without claiming the capabilities of a large enterprise analytics department.
Large enterprises can devote specialist teams to reporting and analysis; this article does not establish any particular company’s staffing count. A small business owner has… themselves. Maybe a bookkeeper and an Excel spreadsheet. The gap between what large enterprises could track and what small businesses could track was enormous.
AI can help narrow parts of that gap. It does not make the capabilities equivalent. Results still depend on data quality, specialist judgment and validation. Use the current Ai1 pricing page and an agreed implementation scope to evaluate total costs, including ongoing expenses.
That’s not an incremental improvement. That’s a fundamental shift in competitive dynamics. And the businesses that move first will have a compounding advantage that becomes very difficult to overcome.
The Window Is Open. It Won’t Stay Open.
AI can support strategic planning and scorecard tracking, but the adoption rate for this specific combination is not established here. The cost depends on the models, connectors and level of oversight your workflow needs. Some reporting tasks can be supported by AI agents and API connectors, but more demanding analysis may still require specialist work.
This will become mainstream. Adoption will vary by business; evaluate it against your own reporting needs. The question isn’t whether your competitors will adopt this — it’s whether you’ll be ahead of them or behind them when they do.
Every week spent gathering data manually is time that might otherwise support decisions; measure the actual effort before assuming the modeled savings apply. The early movers aren’t just saving time — they’re building an intelligence advantage that compounds quarter after quarter.
If you are not using artificial intelligence in your strategic planning now, consider yourself warned. The technology is here. The cost is negligible compared to the alternative. And the businesses that wait will find themselves trying to catch up to competitors who’ve had two years of AI-powered strategic insights that they didn’t.
And if you want to see what it would look like with your data, book a free consultation. We’ll connect your tools, generate your first scorecard, and show you exactly what AI-powered strategy tracking looks like for your business.
The scorecard was always the right framework. It just needed the right engine. Now it has one.
See the Scorecard Tracking Automation in Action
Watch how Ai1 builds and tracks balanced scorecards automatically with our scorecard tracking automation workflow.
Meet the EOS Coach →